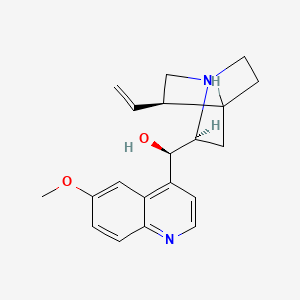
Learn how to estimate quinine sulfate by fluorimetry with the procedure, required chemicals and the theory behind this analytical technique.

Estimation of quinine sulfate by fluorimetry
Quinine sulfate is a medication primarily used to treat malaria. Malaria a life-threatening disease caused by a parasite transmitted by mosquitoes. It works by killing the malaria parasites in the bloodstream also stop the infection from spreading. While it can also relieve muscle cramps and spasms in conditions like restless leg syndrome, it must be taken as prescribed, with the full course of treatment completed. Quinine sulfate can have side effects, including stomach upset and ringing in the ears, so, consult with healthcare professional for guidance.
Requirements
- Chemicals:
- Reagents:
- Quinine Sulfate stock solution (Standard): 100 mg/L.: Weight out 30.2 mg quinine sulfate and dissolve in 250 mL 0.1 N sulphuric acid.
- Quinine Standards (Working): 5, 10 and 15 mg/L. Using 100 mL volumetric flask, dilute appropriate volumes of the quinine stock standard using 0.1 N sulphuric acid as diluent. Mix thoroughly by inversion.
- Sulphuric Acid: 0.1 N: Add 9.0 mL dilute sulphuric acid (6 N) to 500 mL volumetric flask and dilute to the mark with distilled water. Mixed it well.
- Extraction Solvent: Mix 3 volumes of dichloromethane with 1 volume of isopropanol. Mix thoroughly. (4 mL solvent/test.)
- pH 8.5, 0.1 M Ammonia Buffer: Dissolve 5.4 g ammonium chloride in 90 mL (use a 100 mL vol. flask) distilled water, then add 2.5 mL 6 N ammonium hydroxide. Adjust to pH 8.5 using (6N) ammonium hydroxide or 6N hydrochloric acid. Dilute to mark with distilled water and mix. •
- Quinine Control: Bottled quinine water (Canada Dry).
- Test sample: Urine / Tonic Water Apparatus: Beaker, volumetric flask, measuring cylinder.
- Reagents:
- Instrument: Fluorometer/ fluorescence spectrophotometer.
Theory
Fluorescence spectroscopy is a very sensitive and selective analytical technique for detecting and measuring trace amounts of organic compounds. The selective nature of this technique arises because each compound is characterized by an excitation and emission wavelength. Quinine, first isolated from the bark of the South American Cinchona tree in 1820, is an effective anti-malarial drug and used as a flavoring agent in carbonated beverages such as tonic water. Originally, quinine mixed with carbonated water was heavily consumed in the 19th century as a preventative measure for malaria.
Procedure to estimate quinine sulfate by fluorimetry
- Label a series of 16 x 125 mm screw-cap test tubes as: Blank, STD-5, STD-10, STD-15, Urine/test sample, Control.
- Add 2.0 mL of sample to each tube, using distilled water for the blank.
- Then add 1.0 mL ammonia buffer to each of the six tubes and mix.
- Add 4.0 mL of extraction solvent to all tubes, caps and mix by inversion for 5-10 minutes.
- Centrifuge the tubes for 2 minutes at 500 RPM using a clinical centrifuge. Use a setting of 8 on “Speed Control.”
- Aspirate the (UPPER) aqueous layers and then decant each (LOWER) organic layer into a clean, correspondingly labeled 16 x 125 mm screw-cap tubes.
- Add 4.0 mL of 0.1 N sulphuric acid to each tube. Cap tubes and mix by inversion for 5-10 minutes.
- Centrifuge tubes for 2 minutes and 1500 RPM.
- Transfer each (UPPER) aqueous layer to a labeled test tube by means of a Pasteur pipet.
- Start the spectrofluorometer, following the instructions as listed in the instruction manual.
- Consult the instruction manual for guidelines on setting slit widths and scan speeds Measure the spectra as listed below:
Measuring:
- Emission spectra of quinine in 0.1 N sulphuric acid: Use 10 mg/L standard as originally prepared. Set the excitation wavelength to 350 nm and scan from 200 nm to 750 nm using the emission monochromator.
- Excitation Spectra of quinine in 0.1 N sulphuric acid: Using the same solution, and an emission wavelength near the maximum found from the above step, scan the excitation wavelength from 200-340 nm.
- Set the excitation wavelength to 350 nm and perform an emission scan of blank solution from 300-700 nm.
- Set the excitation wavelength to 350 nm. Set emission wavelength to the optimum wavelength found from the emission scan. Place 15 mg/L extracted standard in the cuvette and adjust controls to just keep recorder pen on scale. Now run an emission scan from 300-600 nm.
- With controls adjusted, run emission scans on all remaining solutions including control and unknown.
Calculations
Plot corrected fluorescence signal as a function of concentration (mg/L) and determine concentration of control and unknown in mg/L. Identify-a) Raleigh scattering peak, b) Raman spectra, and c) second order spectra, in the blank emission spectrum. Compare spectra of control and test sample relative to pure standard spectra.
Observation
| Solution | Solution Fluorescence | Total Fluorescence | Corrected Quinine concentration (mg/l) |
| Blank | |||
| STD-5 | |||
| STD-10 | |||
| STD-15 | |||
| Control | |||
| Unknown |
Result
The limit of detection (LOD), using the specified instrument settings, was determined to be ppm quinine in 0.1 N sulphuric acid.
You may also like to read Simultaneous estimation of ibuprofen and paracetamol by UV spectroscopy.
