
Learn How To evaluate size distribution of tablet granules by sieving method and construct size frequency curves including arithmetic and logarithmic probability plots.
Size distribution of tablet granules by sieving method
Aim
To evaluate size distribution of tablet granules by sieving method and construct size frequency curves including arithmetic and logarithmic probability plots.
Requirements
- Sample of granules
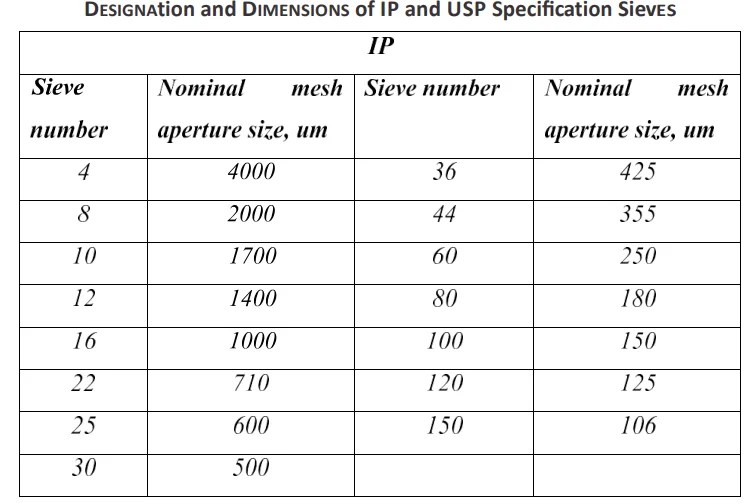
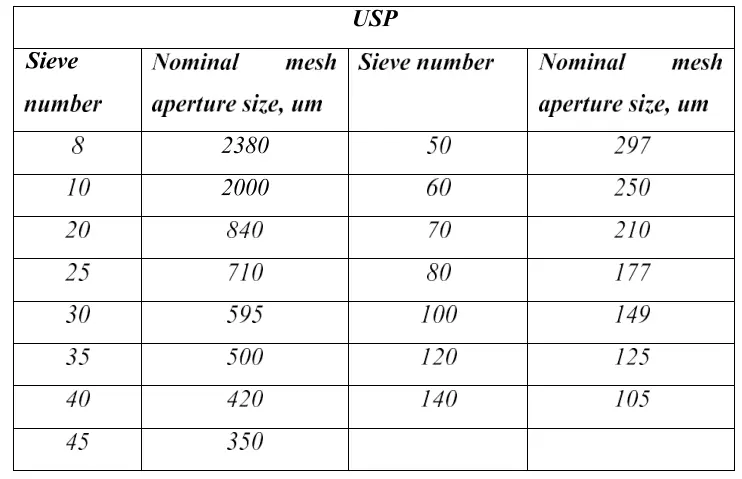
- Standard sieves set (Sieve No 10, 22, 36, 44, 60, 85) Sieve shaker
- weighing balance
- butter paper etc.
Principle Size distribution of tablet granules
Particle size distribution can determine by using methods like sieve analysis, direct imaging, and laser diffraction. Among these, sieve analysis is commonly used. It involves placing granules on sieves and shaking them to separate particles based on size. The retained mass on each sieve is measured, and the results are presented in an S-curve. D-values (D10, D50, D90) represent the particle diameters at which specific percentages of the cumulative mass are divided. Sieve analysis provides valuable information for industries such as pharmaceuticals and mining, aiding in material characterization and process optimization.
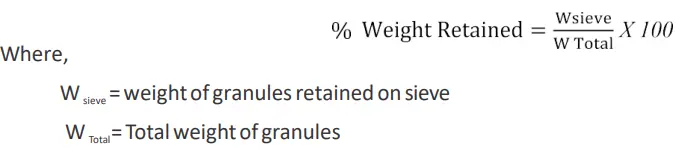
Where,
W sieve = = weight of granules retained on sieve
W Total = = Total weight of granules
Procedure Size distribution of tablet granules
- Select standard sieve. This set consists of various sizes (10, 22, 44, 60, 85, 100 and 120 mesh sieves).
- Arrange the Sieves in descending order of size (Sieve no 10 at top followed by 22, 44, 60, 85 etc).
- Weigh 50 gm of granules and place on the top of the sieve set.
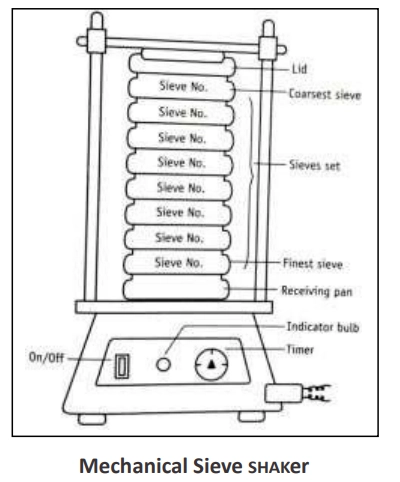
- Place Loaded sieves on sieve shaker and place the lid.
- Adjust The timer for 5 min and switch on mechanical shaker.
- When the shaker automatically stops the sample retained on each sieve is collected on the butter paper and weighed separately.
- Weight retained on each sieve is recorded in the observation table against corresponding sieve number.
- Analyze the data for normal weight distribution pattern. Draw a graph by taking mean particle size of opening on x axis and percentage retained on smaller sieve (undersize) on y axis.
- Plot the log of granules size against the cumulative percentage frequency on the probability scale. It showed linear relationship. Determine the slope of the line and reference point.
- Obtain the geometric mean weight diameter Dg from straight line.
- Calculate the average particle size.
Observations
- Total Weight of granules—————- g
- Time of shaking————- min
Note: Weigh accurately including the bottom pan, the total weight MUST CHECK WITH THE ORIGINAL WEIGHT WITHIN ± 0.3%.
Calculations
Where,
- W sieve = weight of granules retained on sieve
- W Total= Total weight of granules
For average diameter (d average):
d average = ∑nd / ∑n = ………µm
Observation Table

Result
The average diameter of the sample granules is ……….. µm